Getting Ready for Arches v4
If you’ve been following the Arches Project, you know that it’s an ambitious bit of software. Arches allows you to build rich, interoperable, and geospatially sophisticated inventories of cultural heritage.
If you’ve already worked with Arches v3, you know that it takes a real commitment to master all of its capabilities. Things like creating resource graphs (the way cultural heritage data records, or “resources”, are represented in Arches), modifying data entry forms, and importing legacy data into Arches can be tricky.
As a community-driven and open-source project, we’ve worked hard to communicate our ongoing commitment to improving Arches. You may have even noticed that we’re working on some key new capabilities in our upcoming v4 release
Now that we’re well into the Summer, I thought it would be a good time to show you some of the new things Arches 4 can do. There’s a lot to share, so I’ll start with how we’ve addressed perhaps the biggest challenge in v3: creating and modifying Arches resources.
Resource Graphs
If the term “Resource Graph” sounds unbearably technical to you, just remember that Arches requires you to define the “Cultural Heritage Records” that make up your inventory. We call these data records “Resources”.
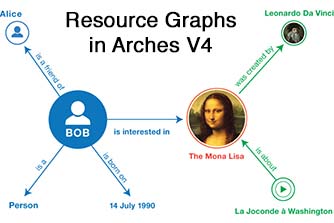
Resources are loaded into Arches as graphs. What are graphs, you ask? Here’s a simple visual example:
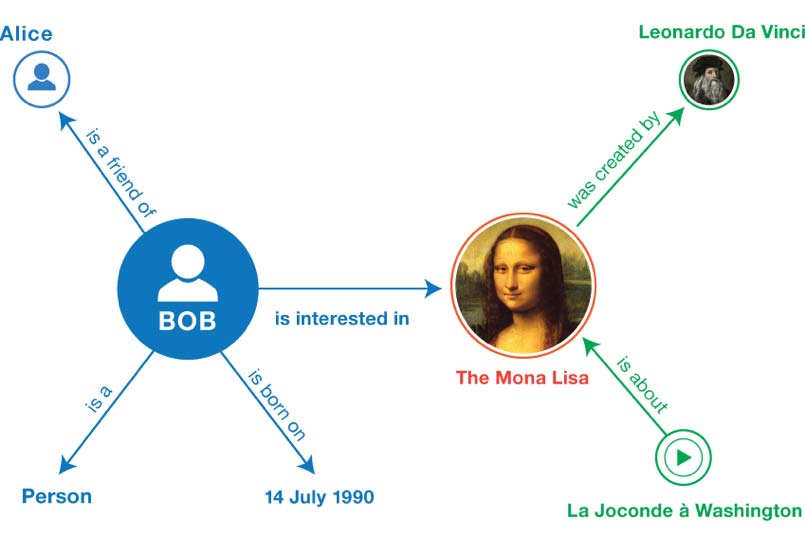
The key idea is that graphs define things (the circles, or “nodes”) and their relationship to other things (the lines, or “properties”). In Arches v3, we provide a set of default resource graphs via the Arches-HIP
Its possible to modify the default Arches-HIP resource graphs, and you can even create your own graphs. But, in Arches v3, its really pretty hard to do so. Why? Because you need to use a graph modeling tool (we used to use Gephi) and that takes time to learn. Also, once you change a resource graph, you need to update Arches’ data entry forms, ensure that proper integration with Arches thesaurus management (the RDM), and update resource reports.
All that meant that you really had to know about technical things like graph data modeling and application programming (specifically JavaScript and Python).
Resource and Graph Creation in Arches V4
In v4, we’ve really made creating and modifying Arches resource graphs much easier. In fact, resources can be created directly in v4 with Arches Designer.
As part of v4, we’re introducing what we hope is a very streamlined workflow for creating resources. Check out the demonstration video below.
[video_lightbox_youtube video_id=”_uAVmV-wigM&rel=0″ width=”1280″ height=”720″ anchor=”https://www.fargeo.com/wp-content/uploads/2016/07/Arches-v4-Resource-Graph-video.jpg” alt=”How to Create Resource graphs in Arches v4″]
Using a simple interface, Arches v4 lets me create a completely new resource by selecting from a suite of graphs (each of which describes a set of related information, data entry forms, and report templates). Best of all, I can design my own graphs and re-use them in multiple resource definitions.
V4 will even let me import/export graphs so that I can share my work with others. As you can see, we’ve put quite a bit of thought towards Arches’ data management capabilities, and we’d love to hear what you think. Drop us line with your thoughts!
Graph Image Credit: W3C Working Group Note 25 February 2014